Markets
Part 2
Supply
As someone with an economics background, one of the most perplexing arguments I’ve ever heard is that supply and demand don’t apply to the housing market. Consider the example of two identical cities exist, City A and City B. Real wages (total wages less cost of living) are $50k per year in both cities. Houses in both cities cost $100k, and residents’ annual housing expenses (for maintenance, mortgage, etc.) are 10% of the cost of buying a house. In City A, new houses can be built for $100k. In City B, no new houses can be built. If there’s an increase in real wages in City A from $50k to $70K, people will move out of City B and into City A to enjoy the higher real wages, and new houses will be built for them. However, if there’s a real wage increase from $50k to $70k in City B, because no new houses can be built, housing prices will rise until people are economically indifferent between living in City A and City B. Since real wages in City A are $50k, residents of City B will go from spending $10k/year on housing to $30/k per year on housing and the price of houses will rise from $100k to $300k.
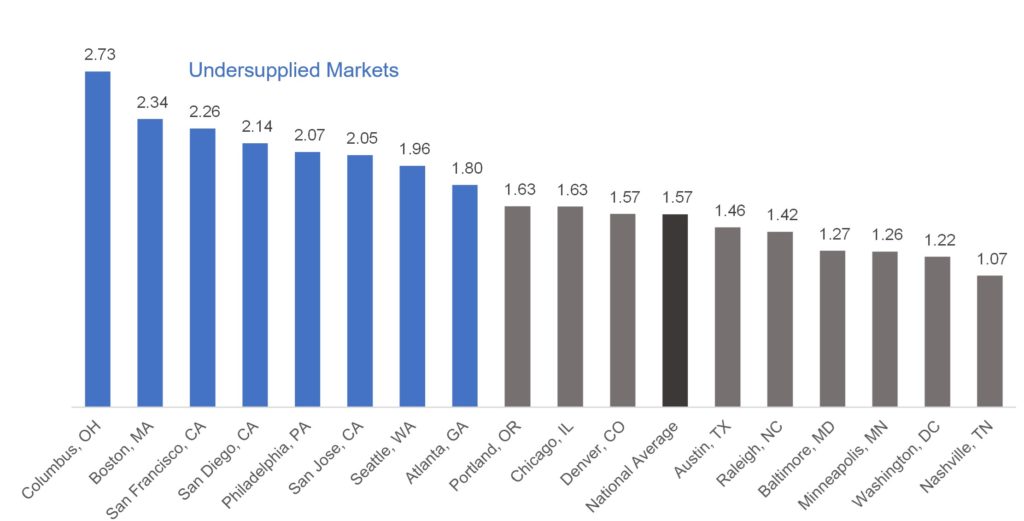
While I personally believe that every city would benefit from having permissive and predicable land use policies, as an investor, supply constraints are a key factor in future real estate appreciation. So how do these top cities fair in terms of supply and demand? Once again, we can look at publicly available data to see how many housing units were permitted (supply) compared to how many non-farm jobs were added (demand). I’ve removed both New York and Hartford from this chart because both lost jobs over the 5-year period.
…as an investor, supply constraints are a key factor in future real estate appreciation.
Non-Farm Jobs Added / Housing Units Permitted – 2015-2019

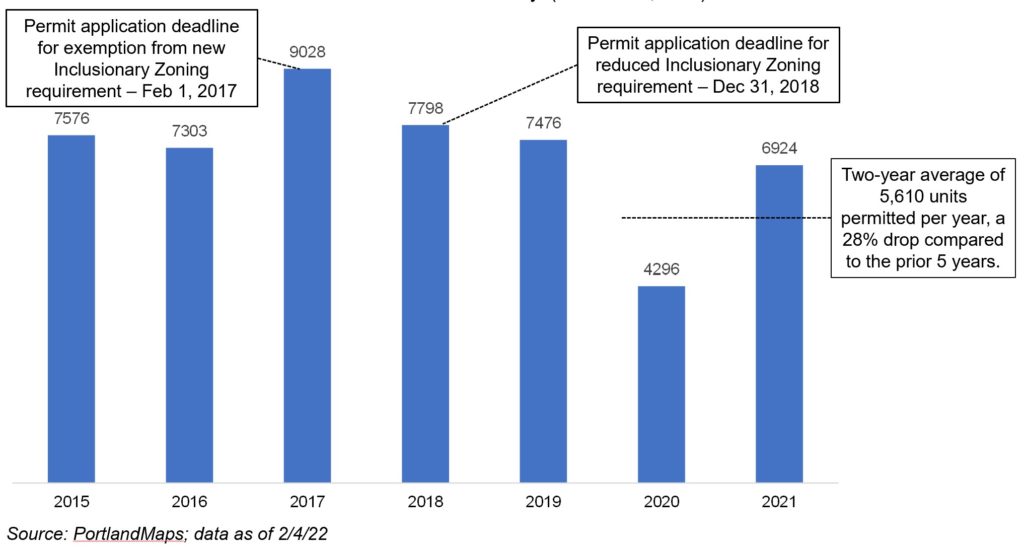
All else equal, markets with higher supply constraints, either geographically or politically imposed, should generate higher levels of real estate appreciation. Similar to changes in infrastructure, changes in supply limitations can also create investible opportunities. One notable example is in Portland, OR, where a new inclusionary zoning requirement has had a dramatic effect on housing permits. The new resolution passed in 2016, with vesting dates in 2017 and 2018 that allowed projects to avoid all or part of the requirement. This initially created a surge of new housing permits as developers rushed to meet these deadline. Then, in 2020, permit activity fell off a cliff before rebounding some in 2021.
Units Permitted – Multnomah County (Portland, OR)

From 2015 to 2019, Multnomah County, which makes up the majority of Portland, OR, permitted an average of just over 7,800 new units per year. Over the last two years, they’ve permitted an average of 5,600.
How much does a good market cost
Warren Buffett has a famously said, “It’s far better to buy a wonderful company at a fair price than a fair company at a wonderful price.” The same is true for real estate investment markets. What we want is a wonderful investment market (good growth potential) where the upside hasn’t already been priced in by the market (reasonable cap rates). There are high-yield markets, like Cleveland, where investments have high cap rates, but high growth rates are unlikely. And there are markets rightly forecasted to grow but where investments have low cap rates, like Austin.
What we really want is to find a wonderful investment market (good growth potential) where the upside hasn’t already been priced in by the market (reasonable cap rates).
The intrinsic value of investment real estate is primarily defined by its NOI and cap rate. The cap rate is simply the ratio of net operating income (“NOI”) to purchase price. An investment that generates $500k in NOI and costs $10 million has a cap rate of 5%. An NOI of $600k on a $10 million purchase price would be a 6% cap rate. However, cap rates are also directly related to growth rates and rates of return. If you assume that NOI is going to grow faster for one investment than another, you will be able to buy the growth investment at a higher price compared to its current NOI (lower cap rate). Alternatively, if you require a higher rate of return for your investment, then you need to pay a lower price versus current NOI (higher cap rate). These tradeoffs relate to each other on a 1:1 basis. Therefore, cap rates can also be thought of as required rate of return minus the long-term growth rate. If you buy a property at a 5% cap rate and NOI grows 4% every year, your investment generates a 9% IRR. And as long as you can sell the investment at a 5% cap rate and we assume there are no transaction costs, then the 9% IRR holds regardless of whether or not you hold the investment forever or sell almost immediately. If you required a 10% return on the same investment, you could only pay a price that equates to a 6% cap rate. A 1% change in cap rate is equivalent to a 1% change in expected long-term growth rate in all cases. Thus, a market that has the potential for higher-than-average returns is a market with positive economic fundamentals (discussed at length above) and reasonable cap rates.
… cap rates can also be thought of as required rate of return minus the long-term growth rate.
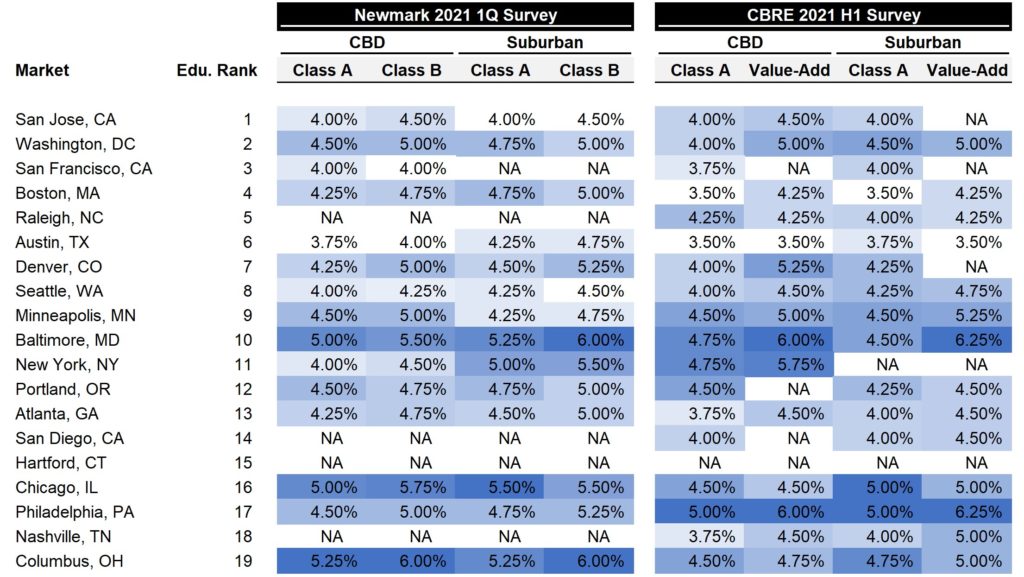
2021 Cap Rate Surveys

Washington DC looks like a relative bargain at the top. Even though DC investors shouldn’t expect an economic boom, DC is a great candidate for stable, consistent growth. Denver looks to be a good market at a fair price towards the back end of the top 10, especially compared to Austin. Seattle also looks compelling because of their massive investment in transit infrastructure. Lower down, Portland and especially Portland CBD, looks like a good bet because of its new supply constraints. And towards the bottom, both Philadelphia and Columbus look like to have great risk/reward profiles, given their own supply imbalances.
More Insights
A look at Cloudline’s market selection process. What are the demand drivers we should be focusing on and how do they compar across major markets?
posted 2/18/2022
Looking at changes between submarkets using geospatial data.
posted 2/23/22
You’ve probably heard the term “Class A Building”. What do terms like this really mean? And better yet, what do they mean for investing?

