
Markets
Part 1
A Tale of Two Cities
As of the 1950 Census, the population of Detroit was just over 1.8 million people, placing it behind only New York, Chicago, Philadelphia and Los Angeles as the 5th largest city in the country. Home to the US auto industry, the city was a pillar of prosperity in the Midwest. Seventy years later, Detroit’s population is just under 640 thousand, a decline of 64% since its peak. In 1971 two real estate developers famously paid for a billboard on the outskirts of Seattle that read “Will the last person leaving Seattle – please turn out the lights.”, in reference to Seattle’s recent population declines. Seattle’s 2020 could not look more different than Detroit’s though. Two declining cities met two opposite outcomes.
When it comes to investing in real estate, markets matter. The same investment in that would have netted a fortune in Seattle, may well have lost one in Detroit. And while no one knows for sure which city will be the next Seattle or the next Detroit, there are some reliable factors we can evaluate to make sure we’re investing in stable, economically viable markets.
For the purposes of this exercise, we’ll look at cities based on their Metropolitan Statistical Area (“MSA”), which is essentially a city and its surrounding suburbs. This will also be limited MSAs with over one and a half million people, just to keep the data somewhat manageable.
When it comes to investing in real estate, markets matter. The same investment in that would have netted a fortune in Seattle, may well have lost one in Detroit.
Education
Regional economies have historically been built on inputs. The fashion industry of New York sprang up because of the city’s prominence as a textile manufacturer, which in turn was the result of its port. The steel industry in Pittsburg cropped up because of its proximity to coal mines. In the same way, modern economies are often centered on knowledge and the spread of ideas, which means the inputs are a collection of smart, entrepreneurial people. While these qualities are a bit difficult to capture in data, educational attainment rates are pretty good proxies. Looking across markets, we can use the percentage of adults with a bachelor’s degree or higher, and see what effect this variable has had on various MSAs in the last economic cycle.
…modern economies are often centered on knowledge and the spread of ideas…
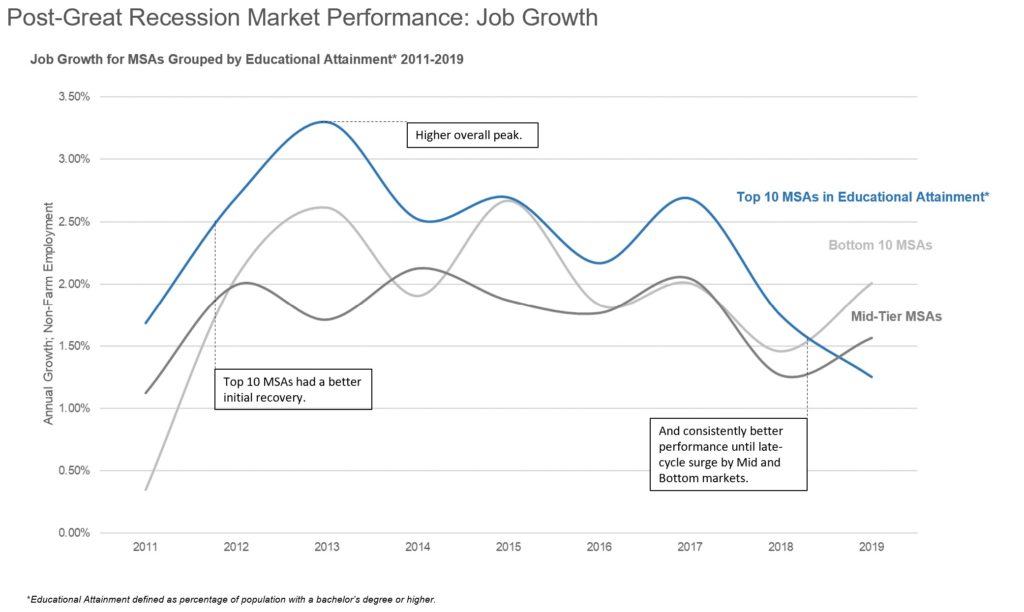
Coming out of the great recession and up until 2019, MSAs that ranked in the top 10 in education (as of 2010) consistently created more jobs than mid-tier and lower tier markets.

Likewise, median income growth was consistent and robust for top 10 education markets coming out of the recession. Mid-tier markets consistently underperformed. Low-tier markets had several “boom” years, but had larger swings and worse performance overall.
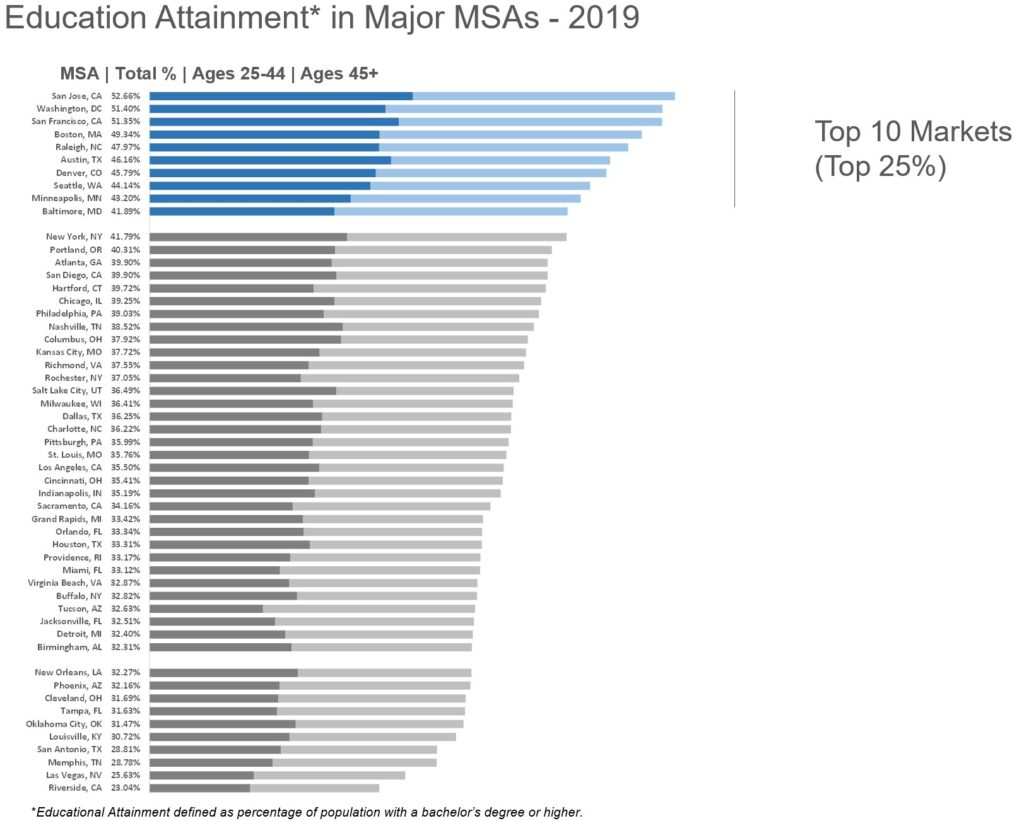
Looking at recent data for which markets now hold the heavily-qualified title of “highest concentration of residents over the age of 25 with a bachelors degree or higher”, it’s the markets you would expect. The Bay Area markets, DC, Boston and Raleigh make up the top 5. Austin, Denver, Seattle and Minneapolis are also no-surprise top-10 cities. Baltimore, given its recent economic struggles, seems out of place among these other 9 cities, but later we’ll examine a nuance to this data that might help explain why Baltimore hasn’t shared the same prosperity.
Anytime you segment data, you need to set arbitrary endpoints. For the two graphs on jobs and median income, I selected the top 10 markets, because this roughly makes a top quartile of the dataset. However, for the exercise of seeing how “investable” these markets are going forward, I’ll concede that there’s not much difference between the 10th spot, Baltimore at 41.89%, and the 18th spot, which is Nashville at 38.52%. I’d like to include Columbus and Nashville because a larger portion of the educated population is under the age of 44, which makes me believe that there are tailwinds for attracting additional educated people in the future, so I’ll include the top 19 markets in the later analysis.
Entrepreneurship
In the above section on education, Baltimore sticks out because of its high concentration of education and relatively low economic success. Presumably educated people fill jobs that require education, a fact which should create some economic growth in and of itself. Jobs requiring education usually have higher salaries. However, what we’re really trying to distill out of this data is the likelihood that a local economy will grow significantly faster than other US cities, and this organic, spontaneous growth often comes from entrepreneurship. The problem for cities like Baltimore is that some jobs require high levels of education but provide almost no opportunity entrepreneurship. If you work for the Social Security Administration in Baltimore, you probably have just as many educated co-workers as an engineer who works at a tech company in Seattle. But while you should have no reason or desire to start a new Social Security Administration, the engineer in Seattle might just break off and start the next Amazon.
…the engineer in Seattle might just break off and start the next Amazon.
To further investigate the differences in the types of jobs between cities, we can look at data from the Bureau of Labor Statistics that categorizes jobs by industry and subsector. These categories are Construction, Manufacturing, Wholesale, Retail, Transportation, Information, Financial, Professional, Education/Healthcare, Public Administration and Other. We can then further group sectors by their likelihood to require education and their opportunity for entrepreneurship:
- Group 1 – Not likely to require higher education (“Non-Edu”): Construction, Manufacturing, Wholesale, Retail, Transportation
- Group 2 – Requires higher education, unlikely to be entrepreneurial (“Static”): Education/Healthcare, Public Administration
- Group 3 – Requires higher education, possibly entrepreneurial (“Entrepreneurial”): Information, Financial, Professional
For the Static and Entrepreneurial sectors, what’s most important is how concentrated those jobs are relative to other markets. Focusing on job concentration allows us to normalize for total population. New York may have more total information workers than any other city simply because it’s the largest, but San Jose will have a higher concentration. Luckily, I’m not the first person to compare industry concentration between cities, and there’s an existing statistic that demographers use for this comparison: Location Quotients (“LQ”). A high LQ shows that the industry is more prevalent in a city than the rest of the country, and a low LQ shows that it’s less prevalent. An LQ of 2 for Financial jobs indicates that there are twice as many financial jobs per capita, while an LQ of .5 means that those jobs are half as common. As a side note, LQs are often used to compare a region to the rest of the country, but since we’re looking at the relative performance of large cities, our LQs show the relative concentrations of jobs compared to all cities with over one and half million people. The below chart shows LQs for our 19 high-education markets, and there are some interesting, if unsurprising, results.
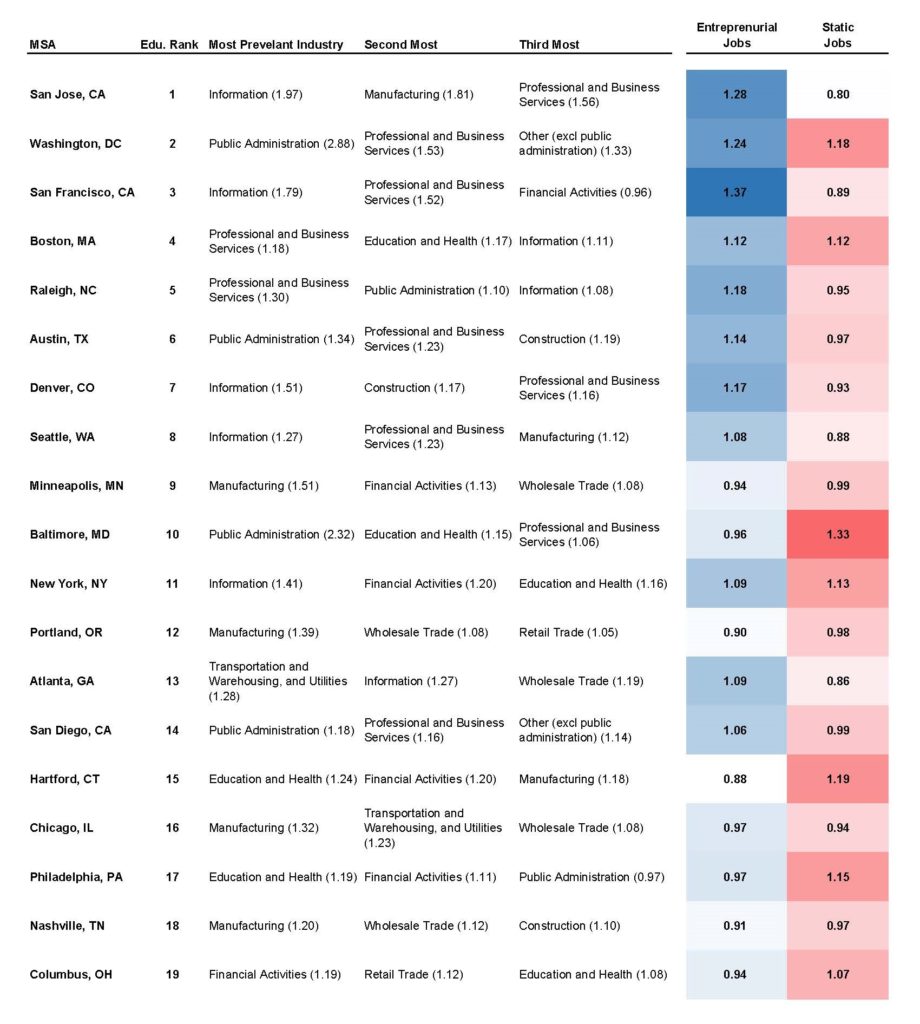
San Jose and San Francisco have the highest concentration of Entrepreneurial jobs, while Baltimore and Hartford have the two highest concentrations of Static jobs. Markets such as DC, Boston and New York have a robust mix of each. Raleigh, Austin, Denver and Seattle all have fairly similar profiles with a slight leaning towards Entrepreneurial jobs. All things equal, economic growth should favor cities with a higher concentration of Entrepreneurial jobs over those with a high concentration of Static jobs. However, from an investment standpoint, there’s always the central question of whether or not that additional growth is “priced in”. If you’re paying a premium to invest in a high-growth city, then it may not necessarily be a better place to invest. We’ll come back to this point later.
Infrastructure
Historically, the way in which people and goods move has had a profound impact on where cities are located and how they grow. The most obvious example of this impact is ports. Almost all major cities are located on the coast or on a major river. One notable exception to this rule is Dallas, TX, but even Dallas’ original growth spurt was due to infrastructure, with a nexus of rail lines allowing it to become world’s largest cotton market at the turn of the 20th century.
Adding a major rail line will no longer turn a small farming town into a major economic hub, but changes in infrastructure still matter tremendously. From our perspective, the most impactful infrastructure changes are to transit, such as new highways or light rail. Transit does two things. First, it makes a city more productive. By reducing travel times, better transit opens up the city’s jobs and amenities to its residents. Second, changes to transit creates areas of change. When a new highway opens, people who may not have been able to commute to or from that location now can.
Since data on infrastructure change is difficult to obtain and normalize, I believe that research and analysis on infrastructure is better done when deciding between a few markets that already meet our investing criteria. With that said, there are a few large, notable infrastructure projects that should be on our radar:
- Seattle – Sound Transit Expansion – The Sound Transit Expansion is by far the most ambitious mass transit project in the country, spending $54b to completely re-design Seattle’s mass transit, including 14+ station openings in the next 5 years.
- Denver – Fastracks – Fastracks is a comprehensive, ongoing project that will significantly improve Denver’s mass transit over the next several decades.
- Austin – Project Connect – Approved in 2020, Project Connect is a $7.1 billion project that will add half a dozen new light rail lines in Austin.
Check out part 2 here.
More Insights
Supply is often just as important as demand, and even a great market can still be overpriced.
posted 2/18/2022
Looking at changes between submarkets using geospatial data.
posted 2/23/22
All about how syndications work, from start to finish.
